Timber price movements
There’s a lot said about rising timber prices – but have prices risen unreasonably over the years? Ted Riddle investigates.
“Lies, damned lies, and statistics” – a quote usually attributed to American author Mark Twain in the late 19th Century, commonly put forward to explain the power of numbers – or maybe the lack of validity behind an argument supported by statistics. It’s amazing to think that a view espoused well over 100 years ago is still considered pertinent by many of us when someone throws statistics into a debate.
Of course, if you ask the right questions and manipulate the target market you can generally make statistics provide the answers you want.
In Australia, we have the Australian Bureau of Statistics (ABS), with their most notable everyday output being the Consumer Price Index (CPI); every year the government quotes the CPI – it’s used by many companies and government authorities as the basis for wage and salary negotiation and increases, and of course we all look at the annualised figures and know that our cost of living has been greater than the paltry figure tossed up as the official CPI.
Price movements in timber
In recent times I’ve been involved in statistic gathering within the timber industry, looking at price movements across a basket of timber and timber-based products used in Australia. The early beginnings of this statistical look at timber prices took place in NSW in the mid 1990’s with the then Forestry Commission of NSW (Forests NSW) looking to get an understanding of the wholesale price of timber where they were in fact the major grower – controlling log prices but not the actual price of timber.
By the turn of the new century, growers in other states became interested in the statistics available to Forests NSW and many agreed to join in the program, providing greater funding for the statistics gathering and processing, and broadening the scope.
Today the program is funded by seven major growers (both government and private) in the eastern states and is managed by the URS Forestry Group, the Australian subsidiary of a large international consultancy company. It’s been expanded to gather price information in four sections of the timber market; softwood, hardwood, panel products and engineered wood.

The perception that timber’s overpriced
Over the years I’ve always heard builders, manufacturers and other regular timber consumers complain about the price of timber and how the increases always seem to stagger the imagination.
As soon as I was asked to be part of surveying members of the timber supply industry about their buying prices, I realised what the project was, and was very keen to be involved. As I said before, if you ask the right questions and you manipulate the target market, you can generally get the answer you want. In the case of the ‘Timber Market Survey’ (TMS) I was interested to see how and from whom the information is gathered.
I thought now might be a good time to show the results of the program, given that I have a ten year window on the pricing movement and we can view it over this period against the published CPI figures for the same timeframe; we should be able to see if timber prices are in fact in a world of their own, or whether it’s a perception more than fact.
To set the details straight, companies surveyed are your suppliers, not producers. They are the timber merchants, big and small, and frame and truss manufacturers; although their buying prices are collected, they are not compared one to one – they’re used in a weighted average form and compared against the same respondent each time to gauge a price movement percentage. From there, the price movements are consolidated and calculated into statistical data across the spectrum.
The numbers: price movements against the CPI
Of the four areas of the survey, two individual products stand out to me, because of the volumes used in both the new house market and in alterations and additions. These are framing (and in particular MGP 10, which is the real staple of both stick and frame and truss framing), and particle board flooring. There are, however, other grades and products that you can see in the charts attached.
The URS timber statistics start with June 2004 as the base, and given that we’re looking at price movement as opposed to actual prices, they use 100 as the base index.
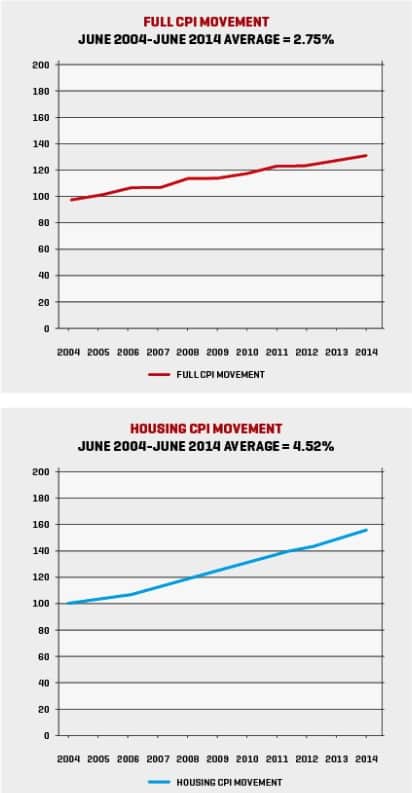
To make the comparisons easier I’ve used the same configuration to look at the ABS CPI figures for the corresponding ten year period. If you look at the ‘Full CPI’ you can see that from June 2004 as its base, the CPI has risen quite consistently – on average at 2.75% per year, which equates to about a 31% increase in the cost of living over the ten years.
If you then look at the URS Softwood Graph and go on a point-to-point basis from June 2004 to June 2014, you can see that the price of MGP 10 has risen to approximately 112 index points, an average over the years of about 1.22% which means about a 13% increase in the price over ten years.
This is certainly not keeping up with base CPI.
A closer look at that graph also shows some dramatic drops through the period. If we were to have started our comparison in 2006 after a major decline in prices, the perceived increase would have been far greater from the 88 bases point start at that time, rather than the actual in 2004. Likewise, if we had started our comparison in 2012 where the prices again dipped below the 2004 base rate we would consider the rise through to 2014 to be exorbitant. Producers, however, must still be battling to make ends meet, as the cost of production generally rises in line with inflation, and at least keeping up with the CPI is necessary – something they haven’t been able to achieve.
You can also see that two of the other major commodity products – MGP 12 and Treated F7 – have moved similarly, while treated decking and sleepers (a landscaping product) have fared better, reaching 122 index points. This equates to about a 24% increase – better, but still not good in comparison to the CPI.
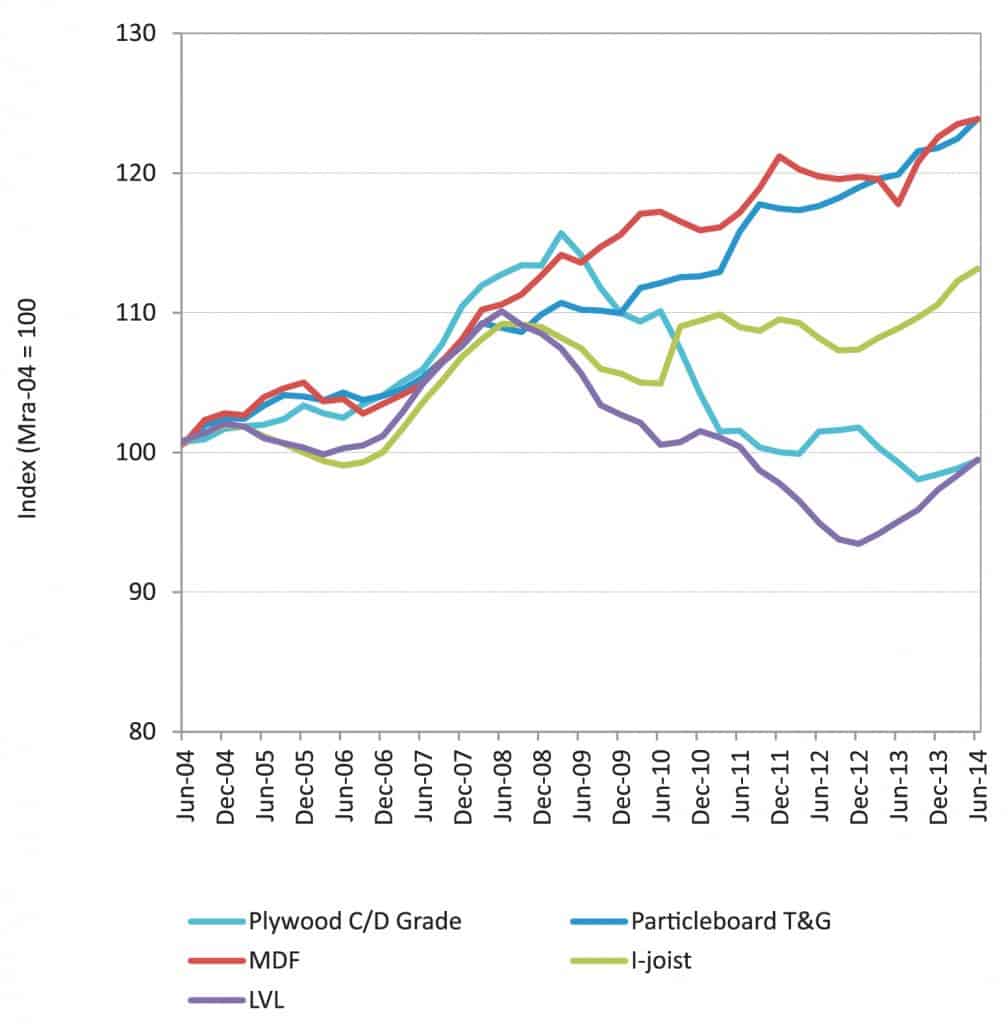
The second URS graph provides figures for both panel and engineered wood products (EWP), and although I think particleboard is the major commodity item, it is good to look at the EWPs because they will continue to grow, both as staple long length and large end section products, as the world continues to wind down from mature growth timber species.
It’s interesting to see that particleboard flooring and MDF have had continued average increases. In the case of particleboard this has probably been at the expense or as a substitute for conventional strip flooring, with price movements similar to the treated products noted before, which are reasonable and consistent – but nothing to get excited about.
The alarming thing to see here, particularly if you were a plywood manufacturer, is the downward price movement of plywood and LVL. You can see in the graph that these prices peaked around 2007/09, where they appeared to be performing pretty much in line with their competition. They’ve now fallen drastically to a position under the 2004 base index though. I haven’t spoken to members of the plywood industry for comment, but this could be a consequence of international competition and in the case of LVL, repositioning of the product to compete with I Beams.

Full CPI vs. ‘housing’
As I was making the comparison between the URS price movement and the CPI, I wondered if I was correct to use the ‘Full CPI’ or go to the components that make it up. The ’Full CPI’ is in fact made up of eleven groupings, one of which is ‘Housing’. Given that is the area in which our market sector is recorded I thought it might be more relevant to compare the performance of timber over the ten years there, rather than the ‘Full CPI’.
The Housing CPI graph shows a very different picture, with an average annual rise around 4.5% indicating an overall increase in the ‘Housing’ sector market of about 54% in the 10 years. I wonder if that increase has been reflected throughout the output of the building industry?
Maybe the resellers and builders are copping it sweet because it certainly doesn’t seem the timber and timber product producers are doing so well.
